How do you rate the sales performance of your B2B marketing efforts?
While sales volume is a good indicator of the performance of your marketing campaigns, it isn’t the only one. A sales pipeline lets you track your leads from prospects to customers throughout a B2B buyer’s journey that is often long and complex.
For each stage, different metrics measure the effectiveness of the marketing strategy. Here are 11 powerful sales pipeline metrics that will help you pinpoint what works... and what doesn’t:
- Sales Cycle Length
- Ratio of Leads to Sales Qualified Leads
- Deal Profitability
- Opportunity Win Rate
- Average Deal Size
- Customer Lifetime Value
- Pipeline Stage Conversion Rate
- Sales to Support Ratio
- Revenue By Product Line
- Customer Churn
- Age of Sales Opportunity
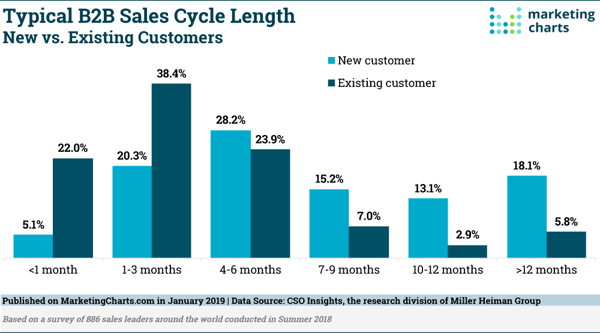
1. Sales Cycle Length
Is your sales pipeline clogged with a seemingly endless list of middling leads? Do you wonder why it takes so long to close deals? Take control of sales pipeline management through the sales cycle length metric.
 Source: MarketingCharts
An overview of your sales cycle length and commensurate variables reveals personnel and/or resource gaps in your sales process. It can also provide insights into why some products have a higher conversion rate than others.
It’s important to note that B2B sales deals can take anywhere from 1–12 months to complete, depending on the industry and the product being sold. Higher-value products typically have longer sales cycles than consumables. For example, in a professional services industry like SEO and link building, the sales pipeline for working with a big firm can be 1–3 months. Whereas industrial equipment sales can often take 6–12 months to close.
To calculate your average sales cycle length:
- Gather closed sale data and compute the amount of time that elapsed between the first contact to each of the deals being completed
- Compare your results to competing brands and products in the same market
It may be beneficial to maintain a sales cycle report to gain a better understanding of any variances that may reveal opportunities to add value to and shorten your sales cycle.
2. Ratio of Leads to Sales Qualified Leads
The ratio of leads to sales qualified leads tracks the rate at which your sales team marks new leads as viable and moves them further down the sales pipeline. More importantly, it is a measure of the quality of the leads generated.
If you aren’t attracting prospects with a high probability of becoming customers, the resulting low ratio of leads to qualified leads alerts you to potential flaws in targeting campaign effectiveness.
In practice, this metric is also good for determining which salesperson (or team) has the best understanding of the customer persona. You can then promote their approach as a best practice for your sales team.
3. Deal Profitability
Of all the sales pipeline metrics we’re exploring, this one might be the most self-explanatory. In simple terms, deal profitability lets you know if the cost incurred to land a deal is worth the total monetary value of that deal.
To calculate how income from a closed sale will offset the amount on closing the sale:
- Add up the total amount of projected expenditures in securing the sale
- Deduct it from the value of the sale
Knowing the profitability metrics of any deal will give you the information needed to decide if you’re spending too much on customers who spend too little. This will allow you to target higher-value clients, promote high-value products, or reevaluate your marketing strategy for promoting low-cost product lines.
RELATED: How to Prove Marketing ROI with HubSpot Revenue Attribution Reporting , Inbound Sales for Industrial Manufacturers
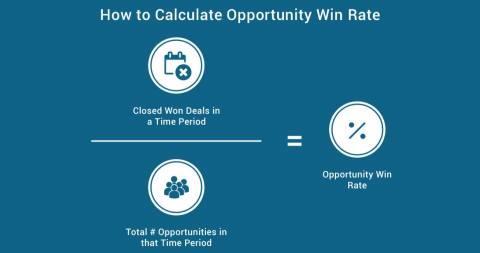
4. Opportunity Win Rate
This metric is a measure of how effective your sales team is at closing deals. It gives you a percentage figure that is a ratio of the number of sales deals closed against the total number of leads.
 Source: Brainshark
Your opportunity win rate varies by product, target market, and the general demographic of intended customers. However, you can compare your numbers against those of businesses similar to yours to identify areas of improvement.
5. Average Deal Size
Average deal size uses the higher and lower range of your closed deals to establish the average amount each deal brings in.
Generally speaking, the average deal size is a useful metric for identifying:
- The amount of money customers are willing to spend for your products or services
- The ideal target customer
- If your products or services are priced correctly
This metric also comes in handy when it comes to sales projections. Let’s say your business is working to achieve a given sales figure by the end of the year. Your average deal size serves as a guide to determining the number of sales required to reach that goal.
For example, if a company’s average deal size is $25,000 and the target is $500,000 in annual sales, at least 25 sales require conversion to reach the intended figure.
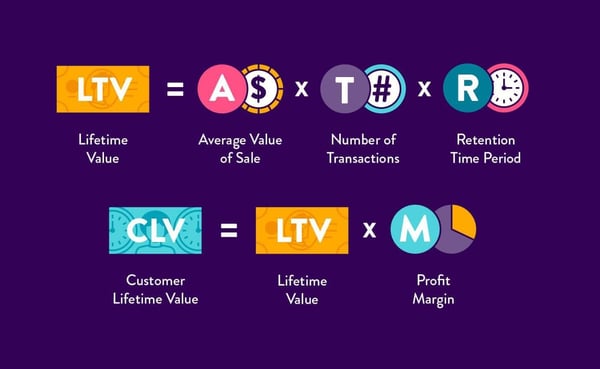
6. Customer Lifetime Value
Studies show that attracting new customers is more costly than retaining existing ones. If you believe in establishing long-term relationships with your customers, then customer lifetime value (CLV) is one of the metrics you should track.
The CLV determines the total value of your relationship with a particular customer and helps you project future revenues from them.
 Source: CleverTap
The main value of this metric lies in its ability to help you determine the types of customers that are likely to generate the most revenue for your business. It also provides insights for maintaining customer relationships and providing long-term value.
RELATED: Using Customer Lifetime Value to Determine the Value of a Lead (Video)
7. Pipeline Stage Conversion Rate
A sales pipeline is made of different stages: awareness, consideration, action, engagement, and advocacy. To maximize your chances of winning new sales, you must have a clear picture of how leads behave as they move through the different stages.
The pipeline stage conversion rate measures the ratio of leads that enter a specific stage and advance to the next one. For example, if you get 100 people to click through to your landing page (awareness) and 10 leads sign up for your newsletter (conversion), the awareness pipeline stage conversion rate is 10%.
Breaking your pipeline into stages is beneficial for evaluating attrition at each stage and comparing it against current industry rates. If the conversion rate for a specific pipeline stage lags behind the competition, you can isolate it and develop strategies towards moving leads past that stage.
8. Sales to Support Ratio
Sales to support is a metric that measures the rate at which your products need customer support after the sale. It helps you pinpoint the products that perhaps have inherent flaws, are difficult to use, or have documentation that is hard to grasp.
A low sales to support ratio indicates that your products come with the desirable qualities of user-friendliness and functional design. It could also mean that you don’t offer enough customer service channels.
However, support teams usually chalk up high sales to support figures to a product being in high demand. While this is occasionally true, it usually means that customers are not satisfied with the product or are at a loss as to how to use it.
READ MORE: See all our articles about Inbound Service here
9. Revenue By Product Line
This metric seeks to measure the performance of each product line as expressed through total sales. For B2B businesses that offer multiple products, this metric is particularly useful for pinpointing both great and lackluster product performance. These key insights drive informed decisions on marketing resource allocation.
As a bonus, you can also refer to this metric when drawing up proposals or pitches to present to tough prospects.
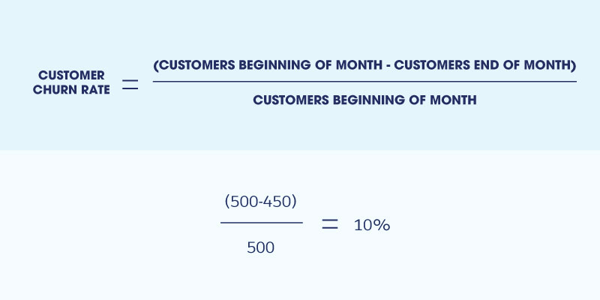
10. Customer Churn
While customer lifetime value measures the amount of projected revenue generated from the average customer, customer churn tracks customer attrition. This metric is useful for businesses that use a subscription model, such as SaaS products, telco products, or paid newsletters.
 Source: Salesforce
The formula for customer churn is straightforward. Just subtract the customers you have at the end of the month from the number of customers at the start of the month, then divide the difference by your starting number.
Average churn rates vary across industries and company ages. For example, the average churn rate for SaaS is around 5%, while established companies that are at least 10 years old have a maximum average churn of 4%.
Why do older companies tend to have lower churn rates? As brands mature, the companies behind them tend to better understand customer needs and know how to position their products to meet those requirements. Also, companies that don’t solve high churn rates tend to have shorter life spans.
11. Age of Sales Opportunity
If it feels like your leads take an excessive amount of time to go through the entire sales pipeline, the age of sales opportunity metric can be illuminating. It measures the amount of time each open lead has spent in your system.
It’s generally accepted that the longer a prospect spends in your pipeline, the less likely it is that the deal will close. The longer the lag, the better the indication that you need to improve the quality and consistency of your sales follow-through efforts — or prospects could go elsewhere.
We live in an analytics-focused business landscape. The best way that you can present progress or regression is through data.
Sales pipeline metrics are designed to account for different parts of the sales process and identify opportunities for improvement that will support sales and marketing efforts.
Leveraging this important data brings an enhanced level of awareness about customer needs, how your products or services are fulfilling them, and spark ideas about how to innovate campaigns that generate sustainable revenue.
Work toward faster, more successful outcomes by getting your sales and marketing teams focused on the same business growth goals. Sales & Marketing Sales Level Agreements: A Guided Tour teaches you how to prepare, build, and implement marketing and sales alignment.

You May Also Like...

Video
How to Execute a B2B YouTube Strategy That Compounds
Lead Generation
Loop Marketing Express Stage: Build an AI-Ready Marketing Foundation