Ready or not, the new year is here! By now, you may have hit the ground running and eagerly dove into your annual marketing plan…but have you dared to ask the tough question:
How different, really, is this year’s plan compared to last?
It’s okay to admit if it’s pretty much the same, especially true if last year’s plan worked wonders and delivered significant ROI.
But if you’re reading this article it’s likely your organization has aggressive growth goals so your 2024 plan needs to deliver more results. Or maybe you’re just stuck on identifying the marketing KPIs that align to your growth goals, which is key to creating an annual marketing plan that keeps you on track to meet those goals.
You’re not alone. And it’s not too late. Let’s dive in together and get started.
RELATED: Download Our Annual Marketing Plan Template
Step 1: Review Last Year’s Marketing Performance
If your CEO asked you to pull together a report card for last year’s marketing performance, what would you report on and how would you determine its ROI?
Before jumping ahead to establish your marketing goals and KPIs, it’s critical to review your past marketing performance. Understanding what your marketing efforts yielded regarding business results and how they contributed to overall company profits in the previous year is the foundation of any solid annual marketing plan.
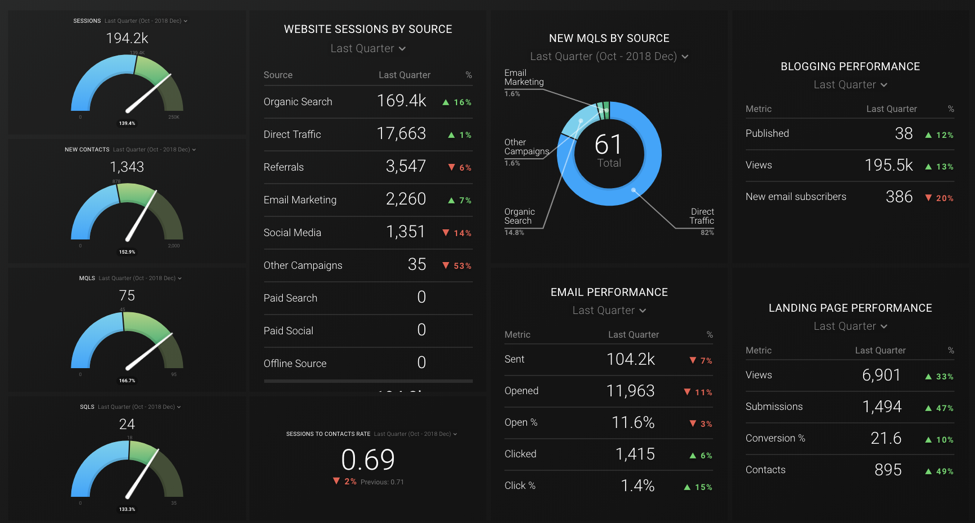
Determine your customer acquisition costs per marketing dollar spent. Then parse out the metrics to see which conversion paths yielded the greatest results. Was it blogging, paid media, emails, social media, trade shows, product demo videos, etc.?
For now, gather the data so you have a starting point and can demonstrate past performance before setting goals for the future.
Step 2: Collaborate with Leadership and Sales
Submitting marketing budgets and plans without having insights into your company’s overall performance goals forces you to play a guessing game. No one likes guessing games. Establishing an effective annual marketing plan can’t happen in a vacuum. Getting Leadership in the same room with Marketing and Sales to exchange a company’s vision and financial goals for the next 12 months and beyond is crucial.
Examples might include achieving a certain revenue growth percentage, breaking into a new market, releasing a new product, or improving overall profitability. Once leadership formalizes these goals and communicates them to Sales and Marketing, you can set specific marketing goals that directly contribute to business goals.
Ideally, sales and marketing will jointly develop goals that hold both teams accountable and position them to support one another. You can do this by putting together a marketing and sales service level agreement if you don’t already have one.
Need some conversation starters? Let’s say Sales and Marketing are tasked with increasing sold revenue by 10% in a specific business segment. Answering the following questions can help you determine next steps:
- What's the average first-year revenue for a new customer (deal size)?
- Knowing that, how many new customers will it take to achieve the 10% goal?
- Based on previous data, how many more marketing qualified leads (MQLs) and sales qualified leads (SQLs) do we need to secure those new customers?
- Is there potential to encourage additional sales with existing customers?
You get the idea. Asking these questions and others like them helps you uncover how to tackle business goals and formulate specific marketing goals to achieve them.
Step 4: Establish Marketing Goals and KPIs
It’s time to dig deeper into that marketing data. Various marketing metrics should be tracked and evaluated to determine if you’re on pace to meet your marketing goals. But what are the true KPIs that align to business results? Below, we outline the “big three” to help you build a foundation.
Marketing Qualified Leads (MQLs)
MQLs are leads that meet all the requirements of attractive potential customers based on demographics, industry, job role, or however you decide to qualify them. They’re interested in your content but are not quite ready to talk to you about a purchase. (Yet.) They need to be nurtured along the way to build trust in your brand until they decide your solution is on the short list of what's right for them.
Determine how your content and email campaigns can guide them on their decision-making path. It’s critically important to track MQLs and conversion rates on your website because, if none of your website traffic was qualified, you haven't really succeeded in impacting your business results.
Also, consider the role that current customers play in attracting prospects and look for ways to leverage their influence and networks. Determine how many more MQLs you need to attract, and focus on the biggest opportunities first.
RELATED: Creating an Effective Voice of the Customer Program
Sales Qualified Leads (SQLs)
An SQL is an MQL that demonstrates an interest in talking to you with the intent to buy. They may have requested a demo or consultation, or even submitted a request for a quote or proposal (RFQs/RFPs). SQLs are also qualified through lead scoring which is determined by various online behaviors and buyer intent data, such as the number of downloads, emails opened, events attended, forms completed, etc.
They're the leads your Sales team wants: qualified and ready to buy! These are the types of leads that should be turned over to sales and who fit the profile of the most attractive potential customers by exhibiting behaviors that signal they won't waste your sales team’s time.
Based on past SQL-to-Deal conversion data, determine how many more SQLs you need to secure in order to reach your growth goals.
Bottom of funnel conversions
This KPI is closely related to SQLs, but it adds a layer of nuance to your marketing performance. Bottom-of-funnel (BoFu) offers are those that give your leads the chance to explicitly demonstrate their interest in talking to you about your product or service. These could be things like:
- Request a quote
- Free consultation, i.e. "design for manufacturability consultation"
- Free assessments
- Schedule a demo
- Schedule a meeting
Generally your nurturing efforts of MQLs are guiding leads to these offers after building trust. But because the sales funnel is often nonlinear, BoFu offers are a good gauge of how all of your on-site and off-site marketing efforts are working to drive conversions. These offers should be prominent on your website so that no matter how a lead arrives at your site, if they're ready to talk, you have a compelling offer and an easy way for them to raise their hand.
Once you’ve established targets for these three “big” KPIs, you can start crafting your annual marketing plan. Based on the level of results that past activity delivered, the channels and campaigns that delivered the best results (more on that below), and the percent growth you need to achieve, you’ll have a base to work from.
Step 5: Embrace What Worked & Ditch What Didn’t
Let’s circle back to where we started in step one. Once you’ve determined your goals and KPIs, revisit last year’s performance to see which efforts are most likely to achieve them.
There are always some aspects of current activities that need to change. It could be a trade show or association that doesn't deliver leads commensurate with the cost, or an e-newsletter that no one reads. Maybe you’ve gotten great leads from paid ads but haven’t committed enough budget to remain competitive. A thorough, objective review calls these out and empowers you to make changes.
Fully adopt new strategies that you've determined will yield greater results and/or “double down” on successful existing ones, and ensure they are resourced adequately. Maybe your blog attracts a lot of views, but you lack adequate conversion opportunities. Consider heat mapping to see where readers “drop off” and include graphics or attractive inline CTAs to keep them engaged. Or maybe you offer on-site product demos that always result in RFPs. Figure out a way to offer virtual demos, maybe via video or live streaming.
RELATED: 12 Types of Marketing Videos Your Team Needs Now
Go Boldly Into the New Year
You've defined specific marketing goals tied to your business goals.
You've evaluated and critiqued your current activities and plans.
Now, it’s time to stop spending your budget and time on ineffective activities and redeploy your resources.
That said, be cautious about tackling too much at one time. Use quarterly roadmaps to choose one or two focus areas with the greatest impact potential, and establish SMART goals for each focus area (specific, measurable, achievable, relevant, and time-bound). Once you’ve addressed the areas of greatest need, move on to the next.
Need help organizing your annual marketing plan? Download our Annual Marketing Plan Template with additional criteria and insights.


You May Also Like...

Video
How to Execute a B2B YouTube Strategy That Compounds
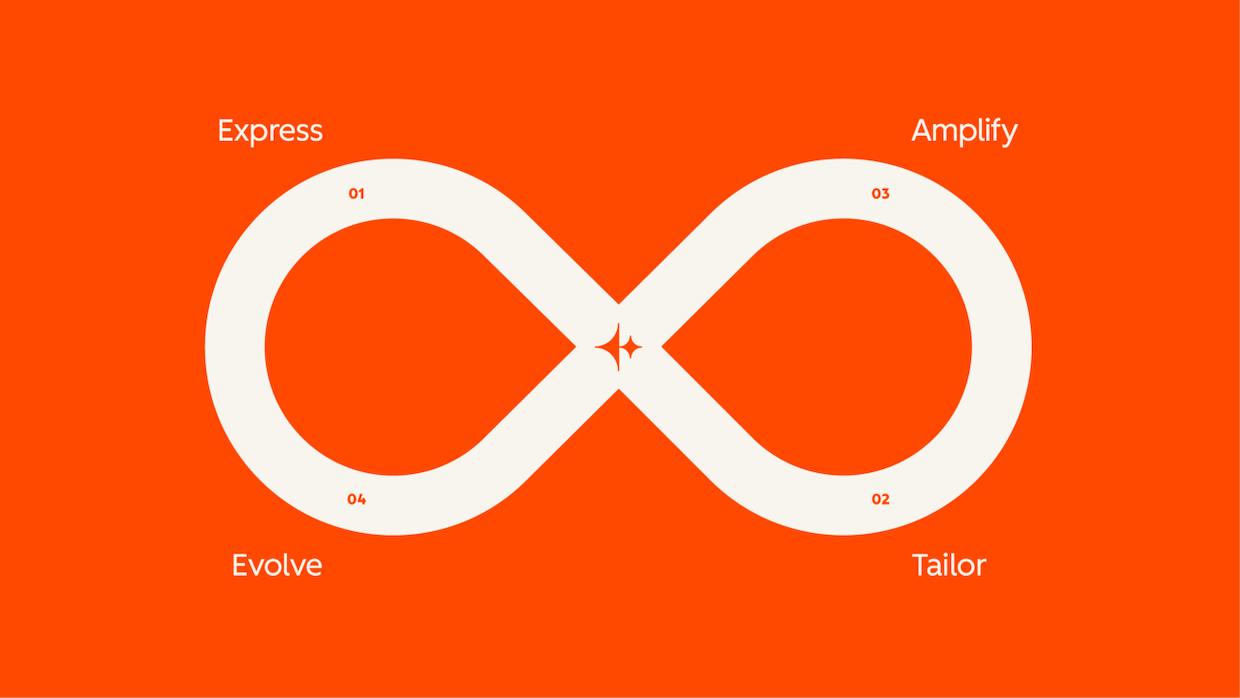
Lead Generation
Loop Marketing Express Stage: Build an AI-Ready Marketing Foundation